Featured Story
Product
Visualize: The Interface for Understanding Your Data


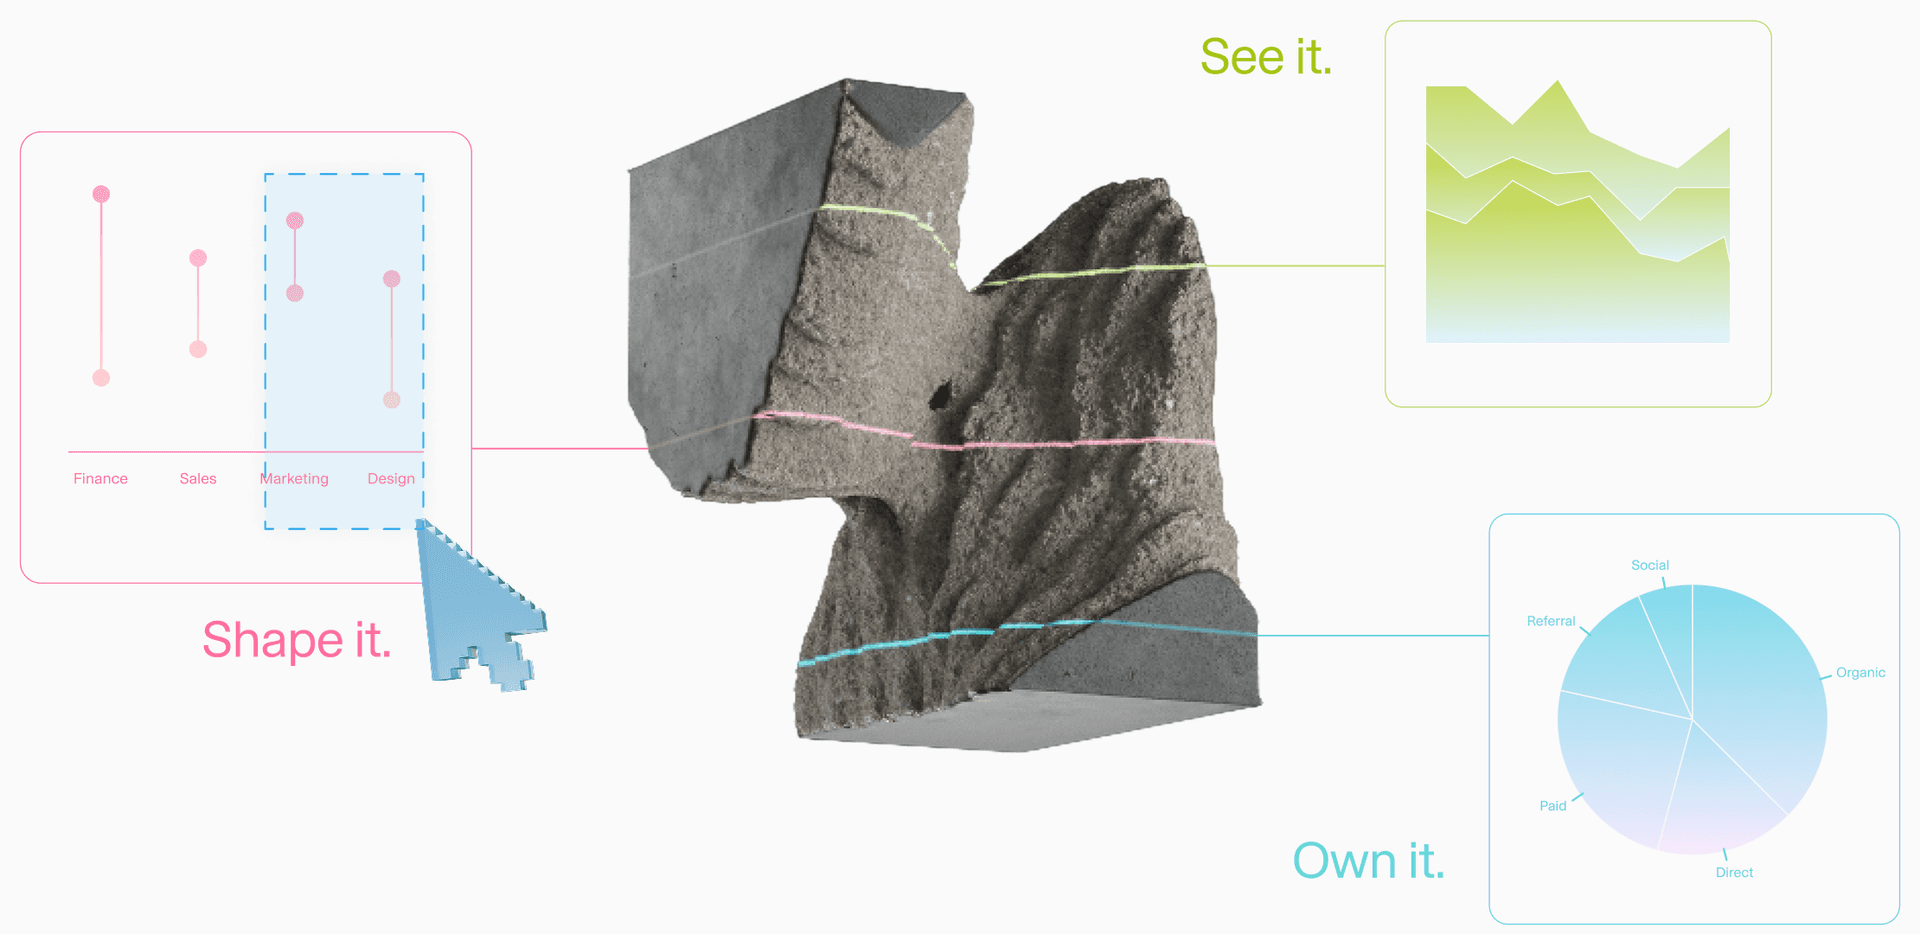
Introducing Visualize, a new way to turn questions about your dataset into interactive charts you can explore, down to the rows behind each pattern. It's the first release from Adaptive Interfaces, and it's available today.
At Adaption, we believe better AI comes from improving every layer, from the data it learns to the interfaces people use to guide it. Adaptive Interfaces explores how people can guide that improvement: inspecting evidence, specifying useful behavior, and deciding what the system should learn next.
Visualize starts with treating data as dynamic and fully malleable. Does your dataset cover the tasks you care about? Which topics dominate, and which barely appear? Do the examples demonstrate the behavior you want your model to learn? Do responses in different languages follow the same style? The answers help you decide what to keep, what to change, and where to add examples.
Ask a question or start from suggestions generated for your data, and Visualize analyzes your dataset and returns an interactive chart you can explore. It analyzes your text and tabular data, helping you investigate patterns and correlations hidden in the data. Click into any part of a chart to see the exact rows behind it, then ask follow-up questions and decide what needs to change.
Exploring Data With Visualize: A Customer Support Example
Consider a team building a support assistant that answers tickets in English and German. They bring in a public dataset of support tickets. Each row includes a customer message, an agent reply, the corresponding department, a priority level, and a language. Visualize gives them three ways to work with it.
Explore
Ask a question in plain language, or start with suggestions generated for your dataset. Visualize works through the analysis needed to answer it and returns an answer with an interactive chart. For the support dataset, you might start with “How do ticket types differ between English and German?” After each answer, Visualize suggests follow-up questions which helps you explore directions you weren’t already looking at. You may use it to guide your explorations or ask by yourself to compare ticket priorities across languages, zoom into some departments, or ask about patterns in the ticket text, or even the style of replies. Each question builds on the previous results, so you can examine the data from different angles without starting over. You direct the exploration as you go, and the results influence what to ask next.
Highlight a Pattern for More Insights
Sometimes a chart suggests insights you want to understand better. With Highlight, you select that part of the chart, and Visualize focuses only on what you selected. For example, a chart might show that refund tickets get resolved more often in German than in English. Select the German refund bar, and Visualize suggests questions about just those tickets, like which queues they come from or how the replies differ. You can also open the tickets themselves and read the actual customer messages and replies.
Customize Charts to Tell Your Story
Shape any chart to tell the story you need. Describe the edit you want, such as sorting, highlighting, or restyling, compare the original and the edit side by side, and save the version worth sharing with your team.
With a clear picture of what good answers should look like, the team takes those findings to Adaptive Data to shape what their assistant learns. From there, they can come back to Visualize at any point to check that the changes reflect what they wanted.
The Way Forward
The AI that matters most won't be the biggest model. It will be the one that keeps learning from the people who use it. That's the future Adaption is building: an AI system that changes at every layer.
Adaptive Data shapes and generates the data your AI learns from. AutoScientist, part of Adaptive Intelligence, co-optimizes that data and the training recipe for a model you own. Today, Adaptive Interfaces joins them as the third pillar, reimagining how people and AI work together.
Visualize is the first step. It helps people understand their data, inspect the evidence, and decide what should change. Our goal is for what people notice, question, and correct to help shape what AI learns next. Intelligence that's custom to you, and yours to own.
Date